fatido/iStock via Getty Images
Here is a look at the Top 10 REITs for Total Return over the past 5 years, as of April 6. As you can see, NexPoint Residential Trust, Inc. (NYSE:NXRT) ranks #3 on this list. Surprised? I was.
FactSet and Capital IQ Pro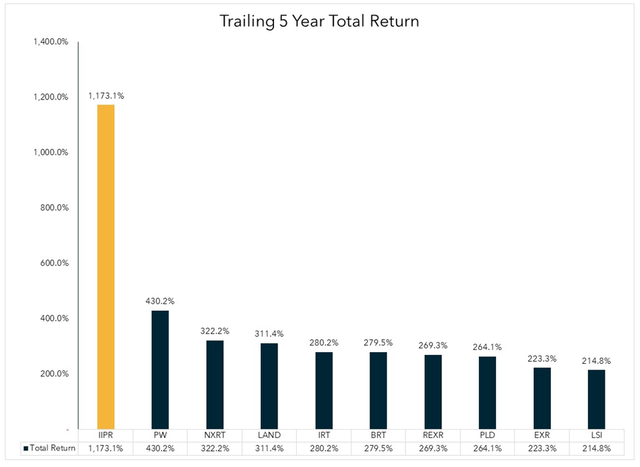
Here are the Top 10 for share price Gain, over that same period. NXRT ranks #3 on this list also.
FactSet and Capital IQ Pro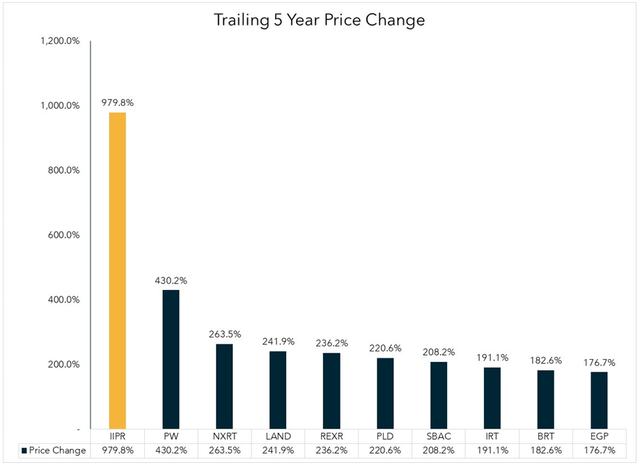
Over the same time period, the trailing 5-year share price gain for the Vanguard Real Estate ETF (VNQ) was 9.66% per annum, which translates to 58.6% when compounded over 5 years. NXRT has more than quadrupled that performance.
Although Power REIT (PW) has lost about 20% since April 6, that company remains in second place on this list.
What has been the secret of NXRT’s success? Are they likely to continue outperforming?
Meet the company
NexPoint Residential Trust is externally managed by NexPoint Real Estate Advisors, L.P. The company buys class B apartment communities (what they call “workforce” housing), and remodels them to provide “life-style” amenities. Currently, NXRT owns 39 properties, encompassing 14,825 units in 11 markets mostly across the Sunbelt (Nashville, Raleigh, Charlotte, Atlanta, Orlando, Tampa, Miami, Dallas-Fort Worth, Houston, Phoenix, and Las Vegas). The heaviest concentrations are in South Florida, Phoenix, and Atlanta.
The company’s strategy is to focus on areas with:
- Major employment centers, near parks and schools;
- A stable work force and positive net population growth;
- Well-paying jobs, provided by a diverse mix of employers;
- A favorable cost of living;
- Not in coastal or gateway markets, thus Reducing competition from larger multifamily REITs and large institutional real estate investors; and
- A limited supply of new affordable housing.
NexPoint Residential Trust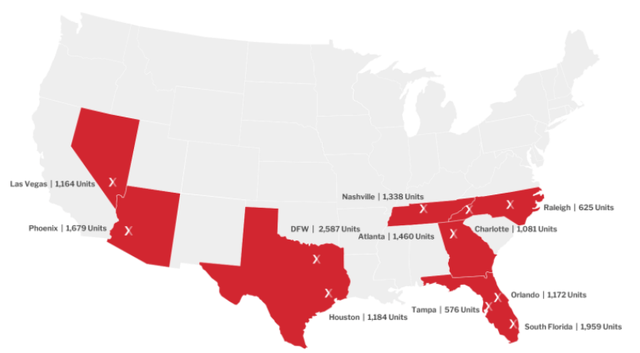
As of this morning, the total portfolio was 96.5% leased, with average monthly rent of $1261 in March. Thus, it takes about $60,000 in annual household income to afford to live in an NXRT apartment. The importance of Sunbelt positioning, to capture above-average population and employment growth, is well documented.
What really sets NXRT apart is lower rents. Compared to the average Class B apartment, NXRT units are relatively cheap, as the figure below shows.
NexPoint Residential Trust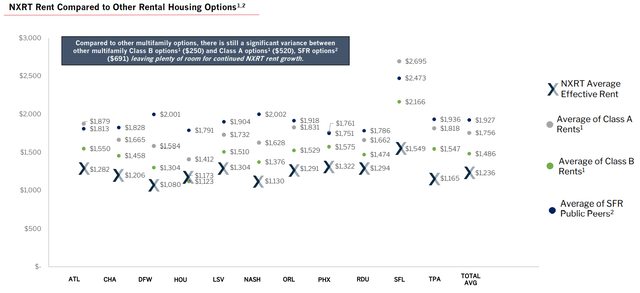
NexPoint residents enjoy an average 21.4% rent-to-income ratio, which allows the household to accrue capital if they so choose, and the vast majority of residents are single.
NexPoint Residential Trust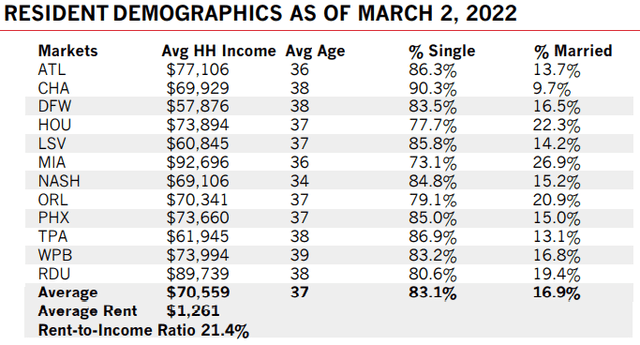
During 2021, NXRT acquired 4 new properties at a total cost of $289 million, and sold 2 properties for $91.3 million, reporting a total IRR of 36.1% on those sales. The company upgraded about 2% of its units in Q4, raising the rent on those units by about 11%, and anticipates 26.1% ROI (return on investment) from those renovations.
For Q1 2022, the company reported revenues of $60.8 million, up 17.4% YoY (year over year), shrinking the net loss 32%, from $6.9 million to $4.7 million. Same-unit rent was up 11.7%, while same-unit occupancy declined 90 basis points to 94.4%.
Core FFO increased 39.5% YoY, from $0.56 per diluted share in Q1 2021 to $0.78 per diluted share. The company picked up the pace on renovations, remodeling 3.6% of their units, earning similar margins to Q4.
Blended leasing spreads reached an impressive 15.6%, with Tampa’s 22.7% leading the way. Same-store NOI growth came in at 16.4%.
On today’s earnings call, Matt McGraner, Executive Vice President and Chief Investment Officer, added:
Our core markets are continuing to experience strong net migration. This population growth and lack of quality affordable housing should remain elevated this year, in our opinion, and . . . compared to other multifamily options, there’s still a significant Delta between Class B, Class A and SFR rents to our markets, with deltas ranging from $300 to $500 unit for multi and nearly over $700 for SFR.
Growth metrics
Here are the company’s figur
es for FFO (Funds from operations), TCFO (Total cash from operations), and Market Cap, over the past 3 years.
| Metric | 2018 | 2019 | 2020 | 2021 | 3-year CAGR |
| FFO (millions) | $32.0 | $40.7 | $57.2 | $63.6 | — |
| FFO Growth % | — | 27.2 | 40.5 | 11.2 | 25.7 |
| TCFO (millions) | $42 | $51 | $57 | $73 | — |
| TCFO Growth % | — | 21.4 | 11.8 | 28.1 | 20.2 |
| Market Cap (Billions) | $0.82 | $1.13 | $1.05 | $2.11 | — |
| Market Cap Growth % | — | 37.8 | (-7.1) | 100.9 | 37.0 |
Sources: TD Ameritrade, CompaniesMarketCap.com, and author’s calculations
These are sparkling growth numbers, worthy of a FROG (Fast Rate of Growth REIT). NXRT kept growing FFO and TCFO at double-digit rates, right through the pandemic. Market cap has only continued to grow, and now NXRT enjoys a position in the market cap sweet spot, between $4 and $10 billion.
Balance sheet metrics
The messy balance sheet makes NXRT a risky bet, and disqualifies NXRT from consideration as a FROG . The liquidity ratio of 1.29, debt ratio of 43%, and Debt/EBITDA of 14.0 are all considerably worse than both the Apartment REIT average and the overall REIT average.
| Company | Liquidity Ratio | Debt Ratio | Debt/EBITDA | Bond Rating |
| NXRT | 1.29 | 43% | 14.0 | — |
Source: Hoya Capital Income Builder and TD Ameritrade
Some of this heavier debt load derives from a business model that emphasizes remodeling units in order to raise the rent, as this requires additional investment of capital. But NXRT does that with fewer than 10% of its apartments in a typical year. This company and its investors are relying heavily on continued rapid growth in income and cash flow.
Dividend metrics
NexPoint is not a great dividend payer at present, but has an outstanding rate of dividend growth, which could make it a strong payer in the long run (5 years or more in the future).
| Company | Div. Yield | Div. Growth | Div. Score | Payout | Div. Safety |
| NXRT | 1.70% | 13.68% | 2.50% | 52% | D+ |
Source: TD Ameritrade, Hoya Capital Income Builder, Seeking Alpha Premium, and author’s calculations
In the table above, Dividend Score projects the dividend yield on shares bought today, assuming the current rate of dividend growth.
Valuation metrics
Among Apartment REITs in America with market cap over $1 billion, NXRT shares are the most expensive. The Price/FFO ratio is a frothy 36.9, and the company trades at a premium to NAV of 19.6%. All this for a below-average dividend payer. In a world gone value-mad, this company is strictly a growth play.
| Company | Div. Score | Price/FFO | Premium to NAV |
| NXRT | 2.50% | 36.9 | 19.6% |
Source: Hoya Capital Income Builder, TD Ameritrade, and author calculations
What could go wrong?
NXRT is externally managed, which can sometimes mean that management incentives do not align with shareholder interests. In this case, however, the external manager is a vertical, which would suffer if the company suffers. Insiders own 12.25% of NXRT shares, and that helps with shareholder alignment also.
James Dondero is President and Chairman of the Board of NXRT, and also President of NexPoint Real Estate Advisors, which externally manages the company. Unfortunately, Dondero has, at best, a mixed reputation. He is currently being sued by Highland Capital Management for siphoning off millions of dollars owed to creditors.
The company is depending on rapid growth to cover its debt load. Any hiccup that affects employment growth or population growth in NXRT’s markets could have damaging effects on the company’s solvency.
My history with this company
I have never owned shares in NXRT. It was on my radar in 2019, but a helpful article by Jussi Askola, published April 29, 2019 on Seeking Alpha, warned against investing in externally managed REITs. With so many good internally managed REITs to choose from, I never got interested in this company, and thus missed out on these spectacular returns. C’est la vie.
Investor’s bottom line
NexPoint Residential Trust is a high-risk, high-reward proposition for investors. Although the housing shortage justifies a premium valuation for quality Apartment REITs, the valuation on NXRT is stratospheric. As a result, the Seeking Alpha Quant ratings have a Hold on NXRT shares, yet the Seeking Alpha Authors and Wall Street analysts view it as a Buy.
Seeking Alpha Premium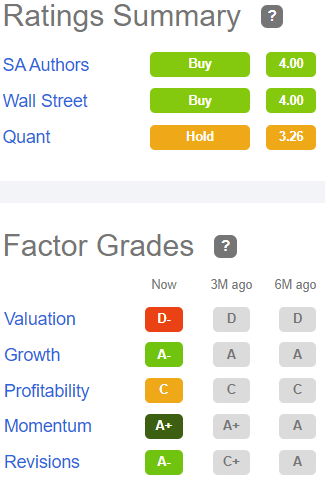
The Street and Ford Equity Research view the company as a Hold, while TipRanks rates it Outperform. Raymond James also rates it Outperform, with a price target of $95, implying just 6% upside. Zacks rates NXRT a Hold.
As for me, I see too much risk at too high a price, and I suspect that future growth may already be priced in.


